


This post is a part of the F# Advent Calendar 2018.
Meet Proba 2
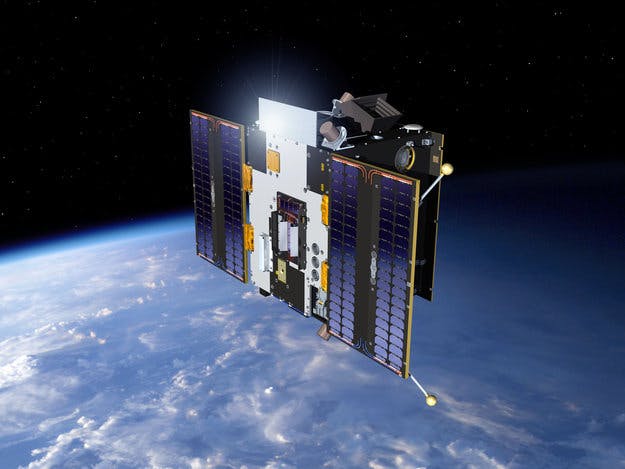
Source: ESA, esa.int/Our_Activities/Technology/Proba_Mis..
PROBA-2 is a small satellite, launched on November 2nd, 2009, and developed under an ESA program in Belgium. PROBA-2 contains five scientific instruments. One of them is the TPMU (Thermal Plasma Measurement Unit), developed by the Institute of Atmospheric Physics, Academy of Sciences of the Czech Republic.
My post is about a bug in TPMU and how I used F# to fix it.
Learn more about PROBA-2: about Proba-2
History of the bug
When the first data come in, the TPMU team found out there was some issue with the data for electron temperature. It turns out that the wrong program was mistakenly copied to its read-only memory - a testing version that was meant to be used on Earth for tests or experiments. This program is different from the real one because on Earth some sensors don't generate any meaningful data (only some noise) their output was amplified through some electronic components. As a result of this, data from TPMU were malformed in some unknown (but consistent) way.

Adapted from source: ESA, esa.int/spaceinimages/Images/2010/01/Proba-2
Basically, this can be seen as a bug in production code in read-only memory in space.
SWARM to the rescue

Source: ESA, spaceinimages.esa.int/Images/2012/03/Swarm
Luckily, another satellite in space measures the same thing. It's called SWARM. We can compare its data with data from PROBA-2. Let's look at its histograms:
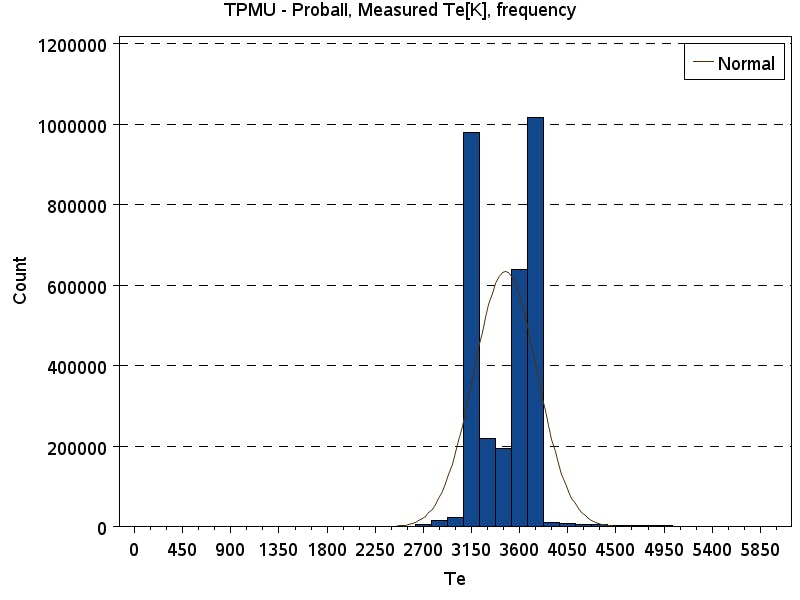
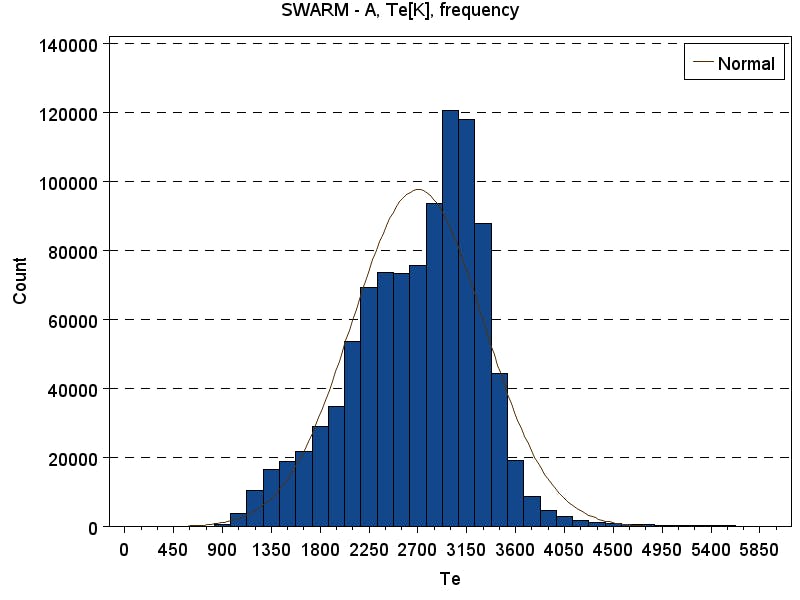
The histogram basically tells us the frequency of numbers among data set.
Can we use this to "fix" our bug in space? We can take SWARM data and treat it as the truth, i.e. how the data should look like, and see, where it leads us. Ultimately, we want to find a function that can be applied to data from TPMU and we get corrected data.
Percentile to percentile
We can compare data set A with data set B, by looking at the number on percentile p in A to the number in the same percentile in B. Percentile is a number in p \ size(A) position of sorted data A*. The only problem is that the sizes of our data sets are different. That's not hard to solve, we map every number from smaller data set to a number in the corresponding percentile of the bigger data set.
F# code that creates pairs of corresponding (on the same percentile) values follows:
let getPairs xData yData =
    let xs = Array.sort xData
    let ys = Array.sort yData
    let xlen = Array.length xs
    let ylen = Array.length ys
    if xlen < ylen then
        xs |> Array.mapi (fun i x -> x, ys.[int <| (float i)*(float ylen)/(float xlen)])
    else
        ys |> Array.mapi (fun i y -> xs.[int <| (float i)*(float xlen)/(float ylen)], y)
The first result
Then we draw a graph from these pairs, where X coordinate is our original data and Y coordinate is the correct data. The result is very interesting:
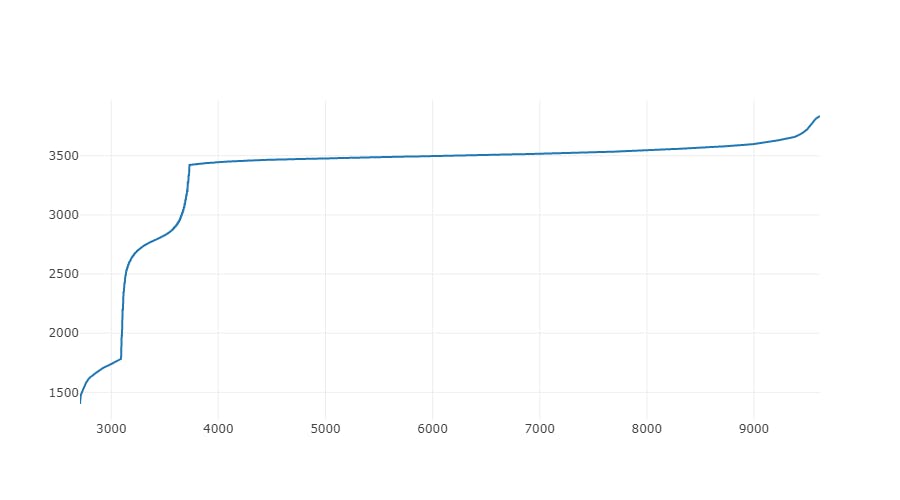
We can see that it consists of three blocks that look like continuous functions, each block is delimited by the visible break in an otherwise smooth graph. There is a good chance that using polynomial regression on these blocks gives us a good transforming function.
Constructing a fitting function - polynomial regression
The goal of polynomial regression is to find the parameters of the polynomial
$$y : x \mapsto p_0 + p_1 x + p_2 x^2 + \cdots + p_N x^N$$
such that the difference from real data points is minimal.
There is a method for polynomial regression in Math.NET Numerics. This method can be used to find optimal parameters
$$p_0, p_1, \cdots, p_N$$
for polynomials of given order from data points.
let fitPoly' order ps =
    let ps = ps |> Seq.toArray
    let xs = ps |> Array.map fst |> Array.map float
    let ys = ps |> Array.map snd |> Array.map float
    let p = Fit.Polynomial(xs, ys, order)
    let f = Fit.PolynomialFunc(xs, ys, order) |> (fun f -> fun x -> f.Invoke(x))
    f, p

/// Get polynomial parameters for fitting function from data pairs ps with polynomial order n
let fitPolyParams n ps = fitPoly' n ps |> snd

/// Get fitting function from data pairs ps with polynomial order n
let fitPoly n ps =
    let (f, p) = fitPoly' n ps
    fun x ->
        let y = Evaluate.Polynomial((x:float), p)
        assert (f x = y)
        f x
Results for different orders of polynomial
To illustrate how polynomial regression became more and more precise with increasing order, I have created graphs for selected orders:
Polynomial order 3
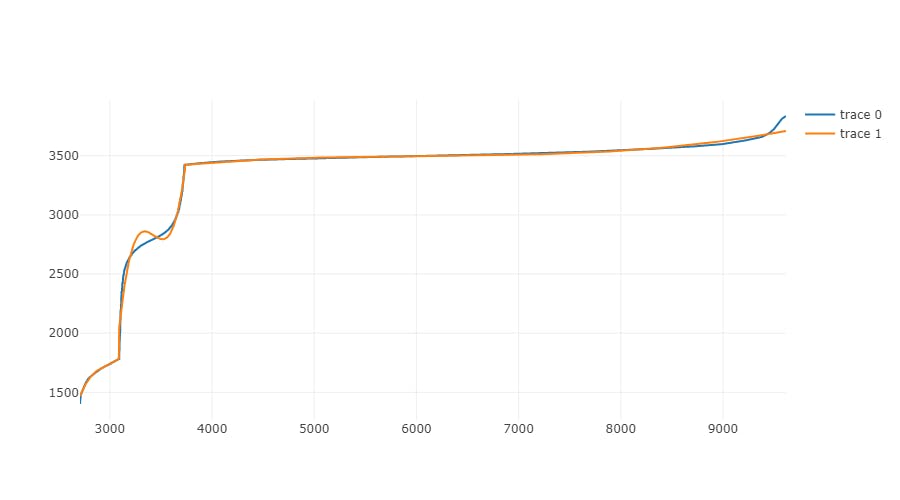
Polynomial order 5
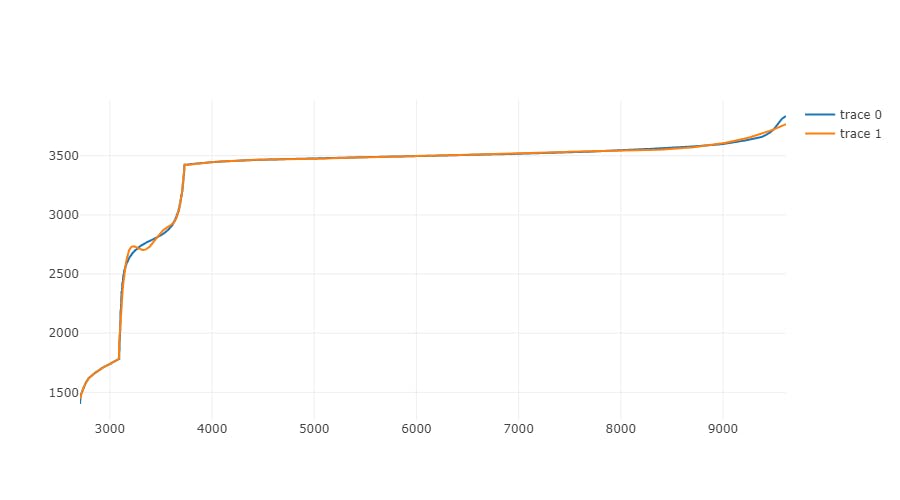
Polynomial order 10
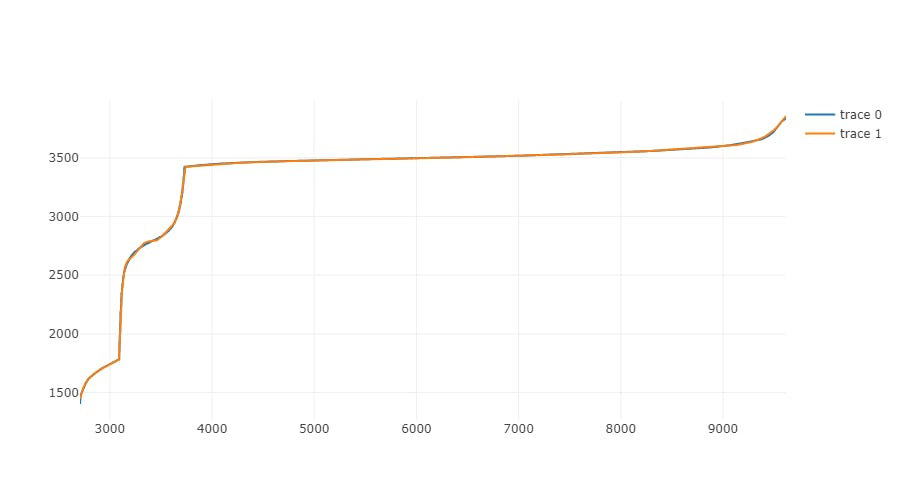
Polynomial order 50

Final notes
To calculate final values, order 50 is used.
There is one important difference from the described process: data from SWARM were recalculated by clever people at the Institute of Atmospheric Physics to values as if SWARM was at PROBA-2 position (according to the mathematical model).
The results of this work were presented at EGU 2017: Abstract, Poster
The source code of my tool that is used to correct data from the satellite is available here.
Links:
http://proba2.sidc.be/index.html/
http://www.ufa.cas.cz/html/upperatm/tpmu/TPMU.html
http://www.esa.int/Our_Activities/Space_Engineering_Technology/Proba_Missions/About_Proba-2